


PANARAY‘s sleek design makes it easy to analyze stocks. Our unique Datagraph visually distills all the relevant information about a stock into one view, allowing you to apply your own investment criteria or utilize our proven O’Neil Methodology.
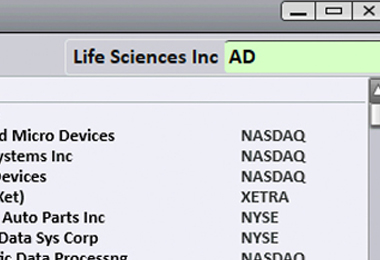
Type in a stock's ticker to quickly get the most relevant fundamental and technical data in our unique Datagraph.
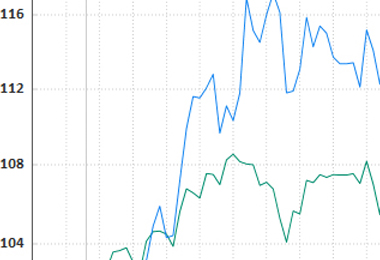
Quickly and easily compare portfolio performance with Comparison Charts.

“The Datagraph answers the hard questions by putting all the pieces together: Why don’t we own this? What does the market know that we don’t?”